Fellow applications for the 2016 Summer Fellowship are all in and we have been busy reviewing the 900 we received! As we go through the very high (virtual) stack of applications, resumes, and recommendation letters (with the help of many alumni fellow and mentors), we wanted to share with everyone a little bit more about who applied for DSSG this year. What are they studying? Which countries, states, and cities are they from? Which universities? What backgrounds do they have? What skills do they have? What are they interested in working on? What motivates them to apply their skills to social good?
Here are some of those answers:
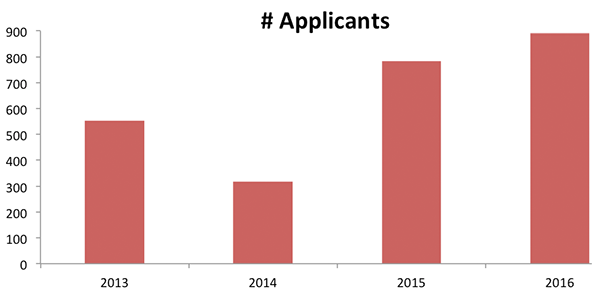
How many people applied?
886 – That is a ~13% increase over 2015 and almost triple the number of applicants from 2014. It’s hard to conclude much from that number (just like every other vanity metric) but we’re happy to see so many people who want to learn to use data science for social good and hope to see many more programs such as ours launch and continue (DSSG Atlanta @ Georgia Tech, DSSG Seattle at UW, and DSSG @ IBM Research).
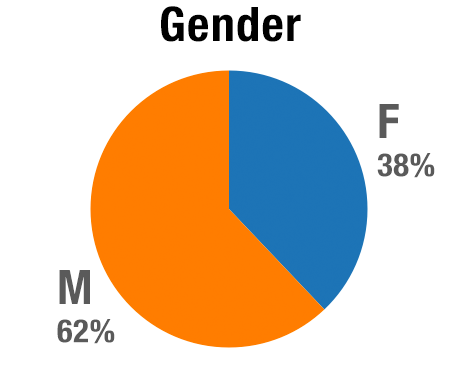
62% (550) of them are male, 38% (336) female – that’s exactly the same proportion as last year. We’re really excited to have a larger applicant pool while maintaining the gender diversity from last year. We’ll continue to strive to increase the gender diversity of not only our applicant pool but also in data science as well as the broader STEM fields.
Where did they apply from?
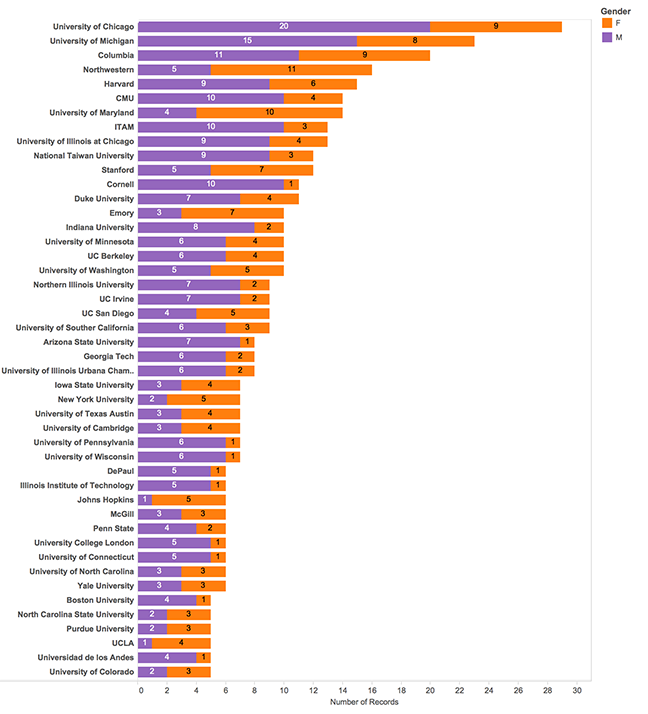
Our applicants this year are from 61 countries, 44 US states, and over 388 universities. That’s 20 more countries and 125 more universities compared to last year. We complained about Alaska and Hawaii not being represented last year and it looks like both of those states obliged this year and have one applicant each! We are missing AR, DE, ME, ND, NV, and OK.

When did they apply?
40% applied on the last day. 20% applied the day before. 80% applied in the last week. We’ll find out if the early birds had any advantage when we review the acceptances.
What are they studying?
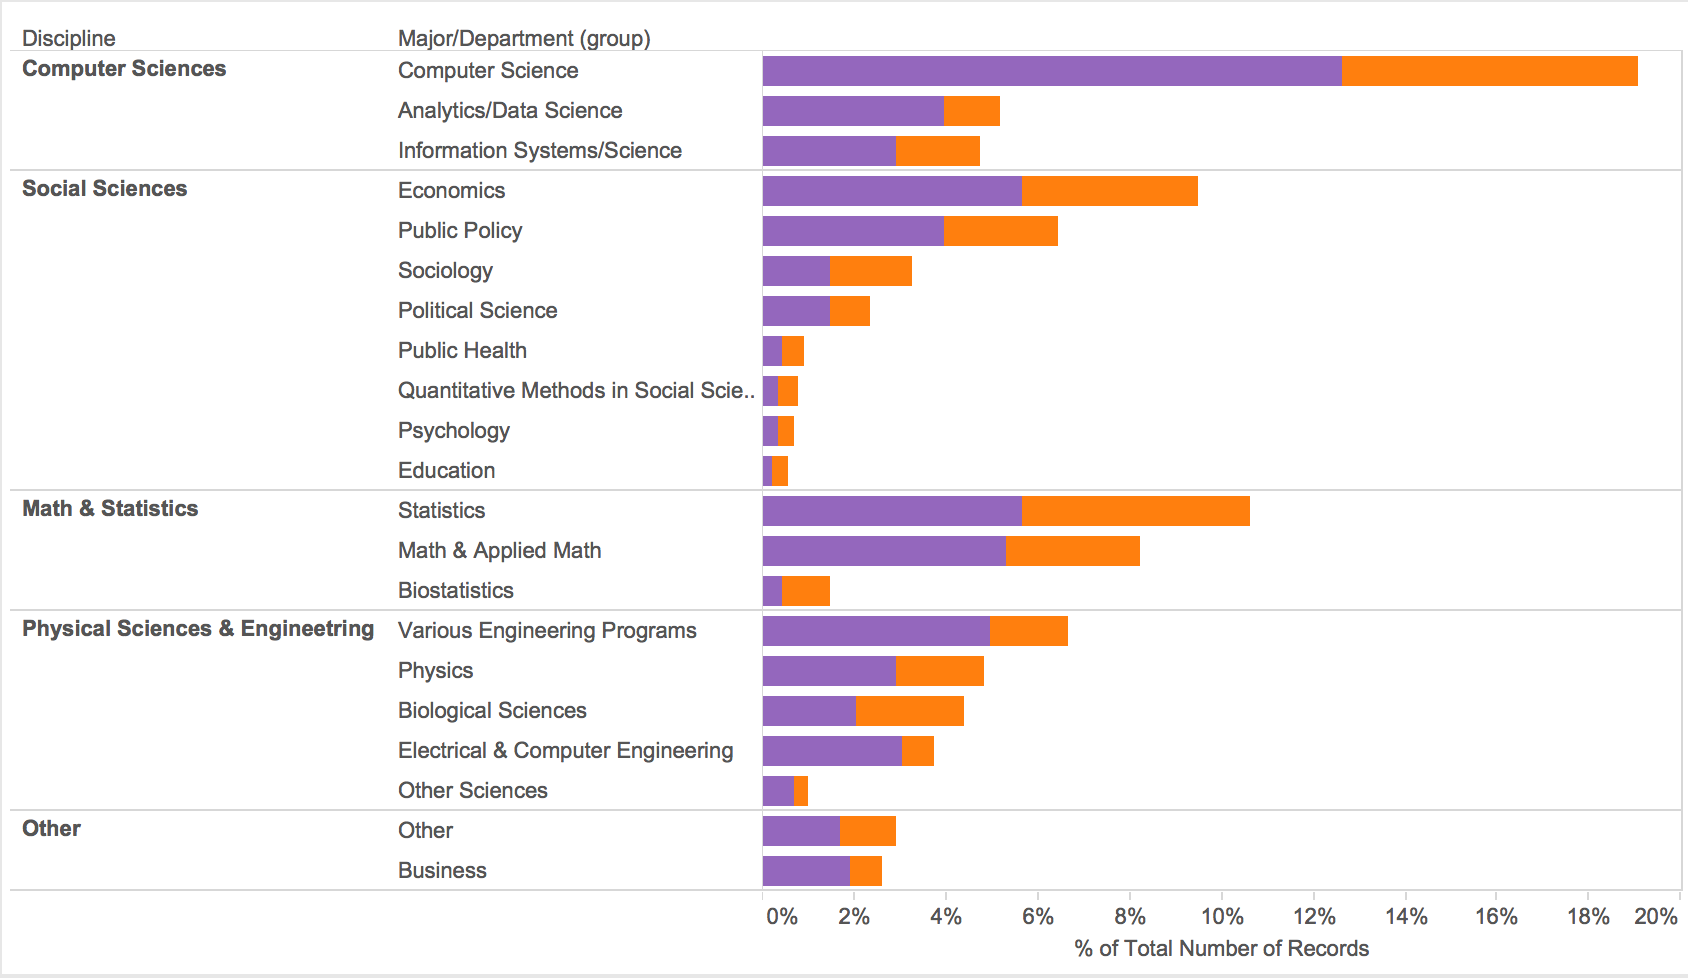
DSSG brings together several disciplines we believe need to work together to solve large-scale data-intensive social problems. Our applicant pool reflects that really well! 29% are studying some flavor of Computer Science (including AI, Machine Learning, Data Mining), 25% Social Sciences, 20% Math & Stats, 20% Other Sciences and Engineering, and 6% other (half of them studying Business).
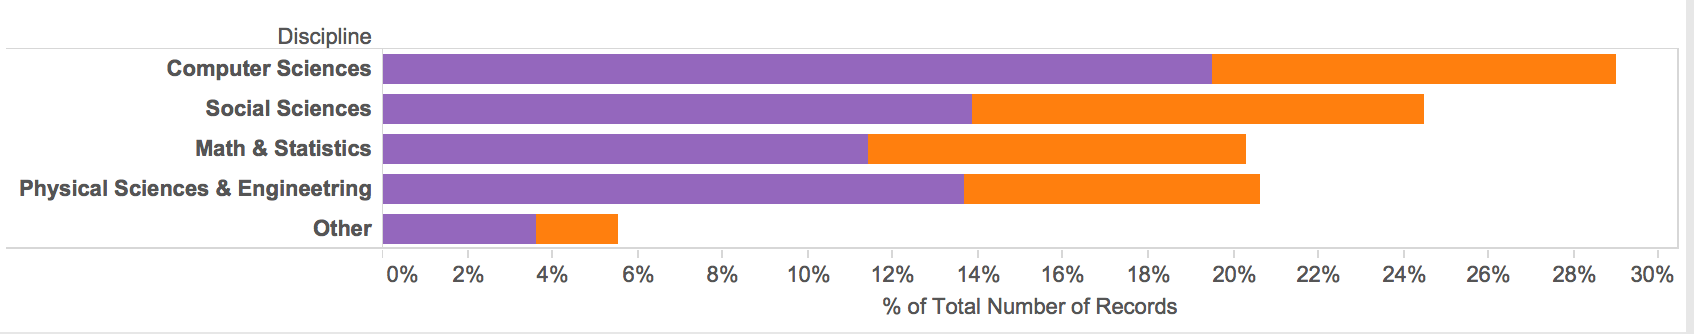
Breaking the disciplines down a little bit…
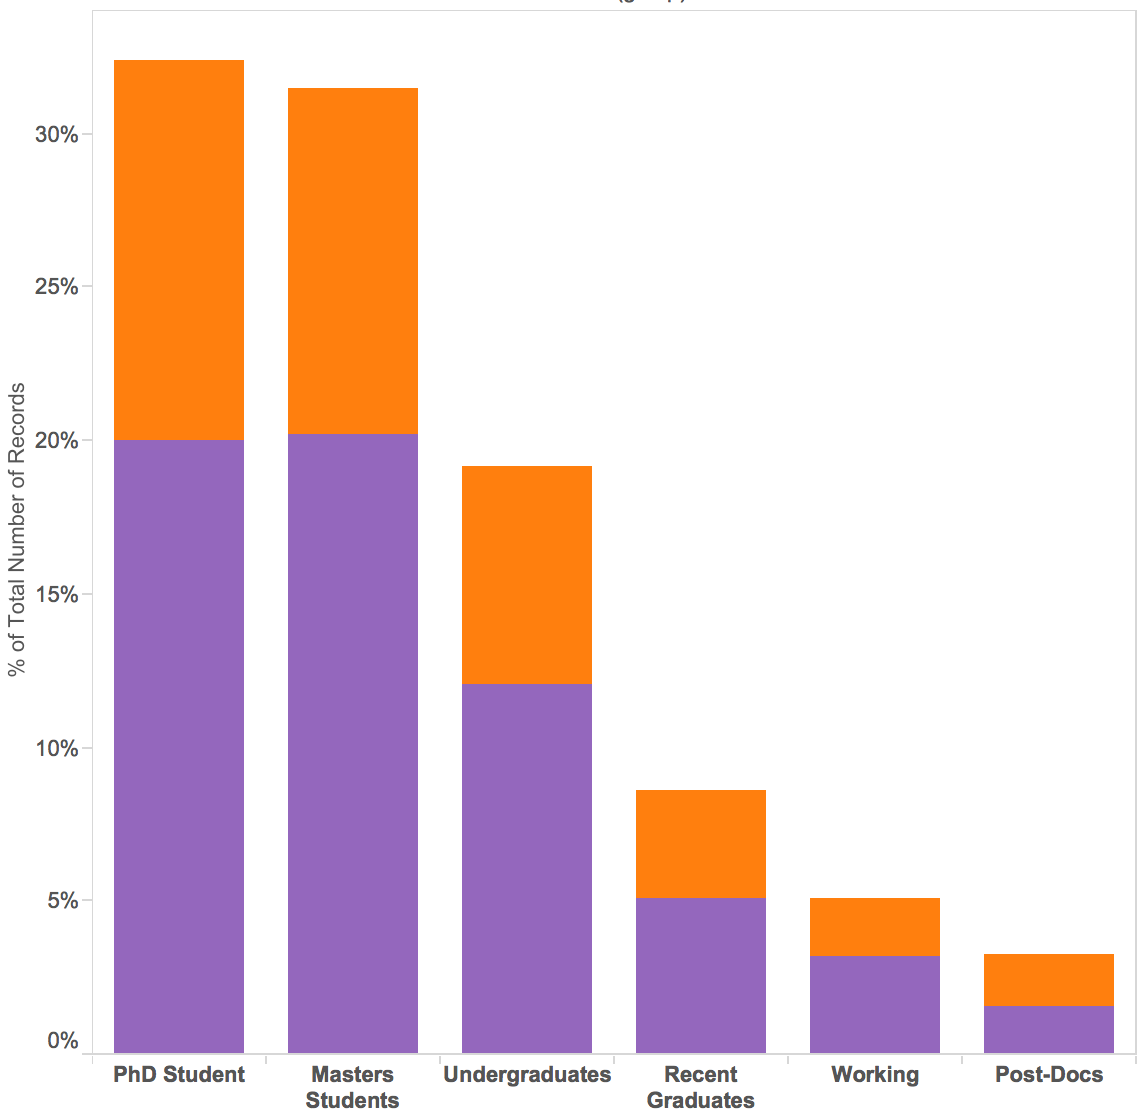
Are they all grad students? Undergrads?
32% are in PhD programs. 31% are in Masters programs. 19% are undergrads and 3% Post-docs. The rest have recently graduated with Undergrad, Masters, or PhD degrees and are currently working, with some of them planning to apply for graduate programs in the near future. This breadth of experience allows us to build teams that can not only solve problems effectively but where individuals can also learn from each other.
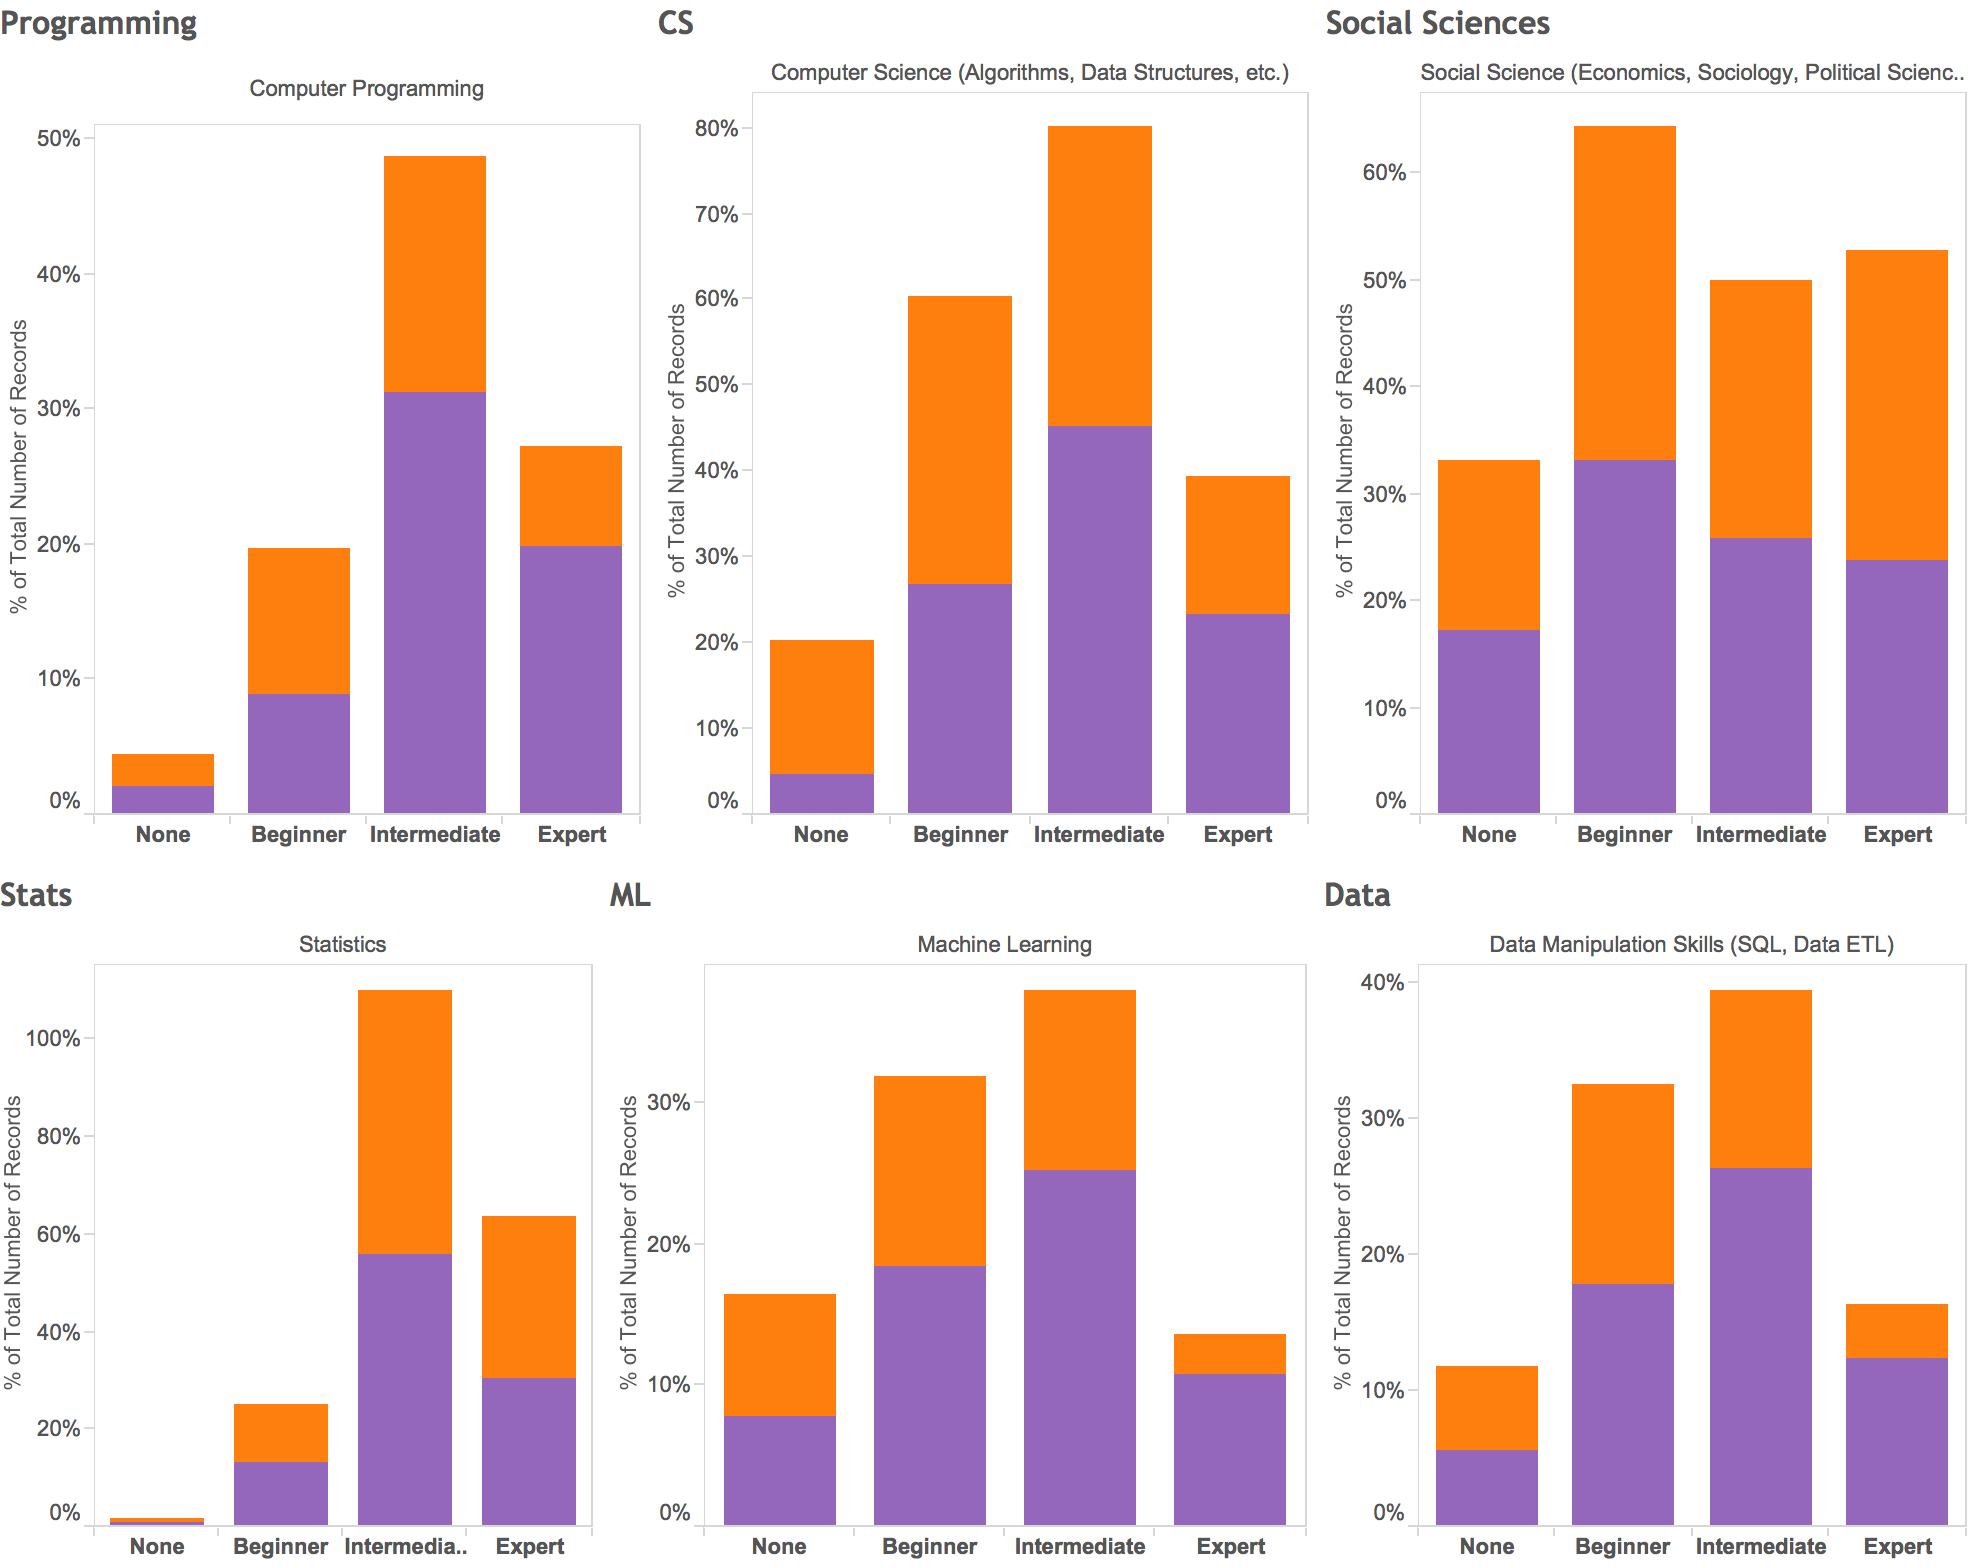
What are the skills that they bring?
Their self-reported skill levels are shown below. We take those with lots of very large grains of salt since (we think) they are extremely biased and don’t have much of a reference point. We asked applications to rate themselves in programming skills, computer science, statistics, social sciences, data manipulation skills, and machine learning. Open-ended questions were also included asking applicants more details on those skills and their experience. We’ll post some analysis of those later.
Stay tuned as we dig deeper into the applications…