Performing data science analysis without business context is like entering bacalhau in a vegan cooking competition: a case of the right answers to the wrong problem. In order to uphold the social good aspect of our work at the Data Science for Social Good fellowship, the first step is making sure we’re addressing the right problem, correctly identifying the specific challenge we need to tackle. Hence, having a good business understanding, in addition to proper interpretation of data, is critical for any data science project. Ultimately, what we want to achieve is better outcomes such as greater efficiency and productivity through improving decision making relating to operations and/ or strategy planning. To ensure that our insights are relevant and practical, our team set off to the Netherlands for site visits to Rijkswaterstaat and the Municipality of Rotterdam!
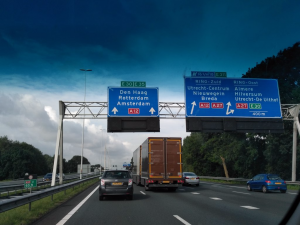
Our partner at Rijkswaterstaat, Mr. Fred van der Zeeuw, has contributed towards our understanding of the business and data. Seeing firsthand how the inspectors patrol the highways and how the traffic control centre reacts to incidents allows us to appreciate the significance of our data analysis. The safety of individuals and flow of traffic lie in their hands, and Rijkswaterstaat has been investing effort in reducing travel time taken to reach the incident sites. We were asked to support their efforts using data related to incidents on the highways of the Netherlands.
Being on the road with the inspectors on patrol, we could feel the passion and dedication of these officers who derived a sense of duty from their work.
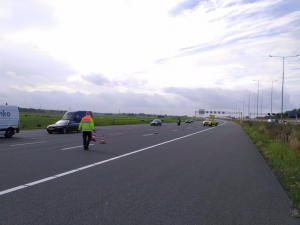
Cordoning off incident site to ensure safety of other drivers
Patrolling assigned roads
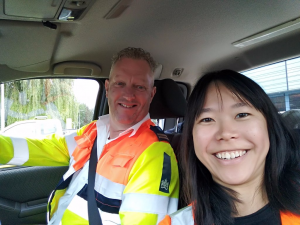
Hui Xiang Chua, with Joop, an RWS traffic inspector
Every day, the inspectors are assigned certain road segments to patrol. They keep a vigilant lookout on the condition of roads and traffic and, based on their experience, they know the areas that require more attention and which routes to take to enable them to reach the designated location in the shortest possible time. Through a data-driven approach to the assigning deployment locations, we hope to build on their intuition and expertise to optimize the resource allocation and improve the current key performance indicator: the percent of incidents reached by an inspector within 15 minutes.
To determine optimal inspector location, we needed two key data points: expected incident data, which we derive from the data given to us by Rijkswaterstaat, and the travel time between locations, which we acquired via Open Source Routing Machine. It’s worth noting that in many cases the time it takes to travel from point A to point B is different from the time it takes to travel from point B to point A, depending on the direction of travel. The implication of this is that our travel time matrix is not symmetric, which makes the optimization problem more complex.
As a proof of concept, we ran our optimization algorithm for a specific day and a specific segment of road. We chose highway A4 between Amsterdam and Rotterdam, which has the 8th most incidents during weekday rush hours out of all roads in the Netherlands, with 16,500 total incidents between 2014 and 2016. We allocated the 15 inspectors along the road by simulating their locations so that all incidents could be reached within the shortest average travel time. We also compared our current results to the actual response times. We presented our preliminary analysis to RWS and were excited to obtain positive feedback on the feasibility of a pilot implementation. Our next step will be to refine the current model assumptions to be more reflective of reality, such as considering the uncertainty of incident locations, simultaneous occurrence of incidents, and variability in travel speeds during different times of the day.
Hui Xiang Chua

Victor Vicente
Sefi Mintzer

Fred van der Zeeuw (right) with Rijkswaterstaat colleague Jan Seinen
During our time in the Netherlands, we also visited the Municipality of Rotterdam, who are on a mission to enhance rooftops in the city of Rotterdam as part of their urban planning. To improve sustainability and mediate the effects of climate change, Rotterdam is putting its rooftops to use, not only as a source of solar energy, but also for vegetation and water storage. In order to determine the size and direction of promotional efforts to encourage such alternative rooftop usage, Municipality of Rotterdam is interested to identify and measure the current usage of rooftops; they are addressing this challenge using data science, analysing satellite imagery using machine learning algorithms with the help of another DSSG team.
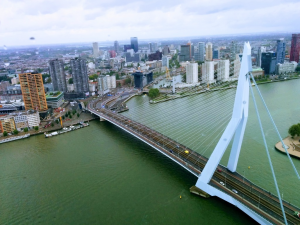
View from De Rotterdam
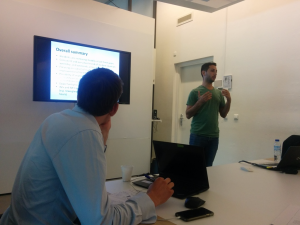
Paul van der Boor, our project manager and the co-founder of the Data Science for Social Good Europe program, also shared various applications of data science in urban planning with the business partners, and we had an interactive session to explore ideas and concerns. We then had lunch at a charming garden rooftop cafe and learned that there were many enthusiastic volunteers maintaining the rooftop garden. We then took a short tour of the city to look at the many ongoing projects relating to enabling an energy-efficient Rotterdam. It was interesting to hear how certain city initiatives were re-designed after strong feedback from the citizens of Rotterdam.
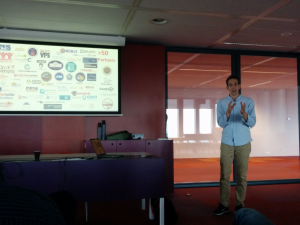
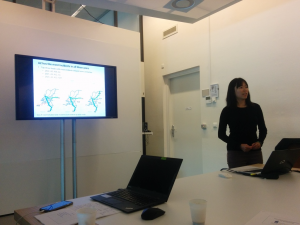
Paul van der Boor presenting previous DSSG projects

Garden rooftop cafe where we had our lunch
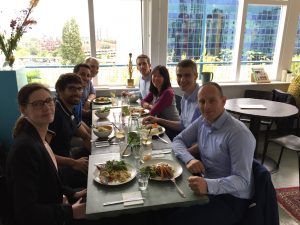
Enjoying our lunch with partners from the Municipality of Rotterdam
Through the various meetings, it was heartening to know how data science could impact the real world. It has been a fruitful trip for all of us!