This fall, more than 2 million American high school seniors will apply to college. A growing body of research tells us that low-income students are at a disadvantage in this process. Even when they beat the odds and do well in school, they often don’t know that they’re qualified to attend selective colleges, or that financial aid is available to them. Of high-achieving students whose family incomes are in the bottom 20% nationally, more than half undermatch in college enrollment — either they don’t go at all, or they go to a two-year or non-selective program where the typical student has much lower academic qualifications than they do.
Consider two real students, Anthony and Ben (names changed). In terms of the academic indicators that are most important to colleges — high school GPA and PSAT score — Anthony and Ben are nearly identical. But Ben went to a high school with richer classmates and he’s white rather than black. So even though they’re equally good students, Ben ended up going to a more academically demanding college than Anthony.
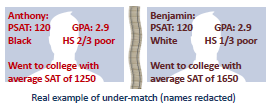
One way to put a number on this college quality gap is that Ben’s college has an average SAT score that’s 400 points higher than Anthony’s college. And this difference has the potential to impact their lives much more than a line on a resume — it affects the resources and attention that are available to them during college, their chances of graduating, and the educational and career paths that they’re likely to take.
Students like Anthony reflect missed potential. When they go to the selective colleges they’re qualified to attend, they graduate college at much higher rates — in fact, at the same rate as students like Ben. Moreover, because selective colleges often have more resources and give out more financial aid, they often cost less than the schools that students like Anthony typically attend, which means less debt and a lower chance of dropping out due to financial reasons.
Doing something about the college undermatch problem is essential to leveling the educational playing field. And while it isn’t the biggest piece of the educational inequality puzzle, it’s something that can be addressed with small, targeted interventions — direct contact from guidance counselors and colleges, filled-out applications and fee waivers — rather than large-scale structural and institutional changes.
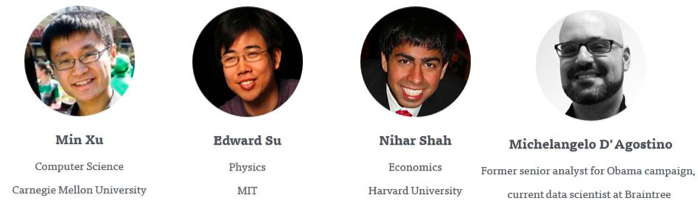
One way to make those interventions more targeted is to take advantage of the trove of educational data that forward-looking school districts have been amassing for more than a decade. One such district is the Mesa Public Schools, and our team — Min Xu, Edward Su, Nihar Shah, and mentor Michelangelo D’Agostino — worked with them to identify students at risk of undermatching and give them the information they need to make informed college choices.
Data-driven guidance counseling
This work is part of a larger effort by Mesa Public Schools to analyze data on what happens to its graduates to inform how today’s students are educated and advised. They’re shifting their focus from merely getting kids to graduate, to positioning them for life trajectories that maximize their potential.
The town of Mesa is a suburb of Phoenix. Its public schools form the largest school district in the state of Arizona, with about 70,000 students in grades K-12. Its six high schools vary in demographics — Mountain View High School is 80% white and has an average family income of $90,000, whereas Westwood High School is 40% white and 40% hispanic, with a $50,000 average family income and 75% of its students qualify for free or reduced lunch.

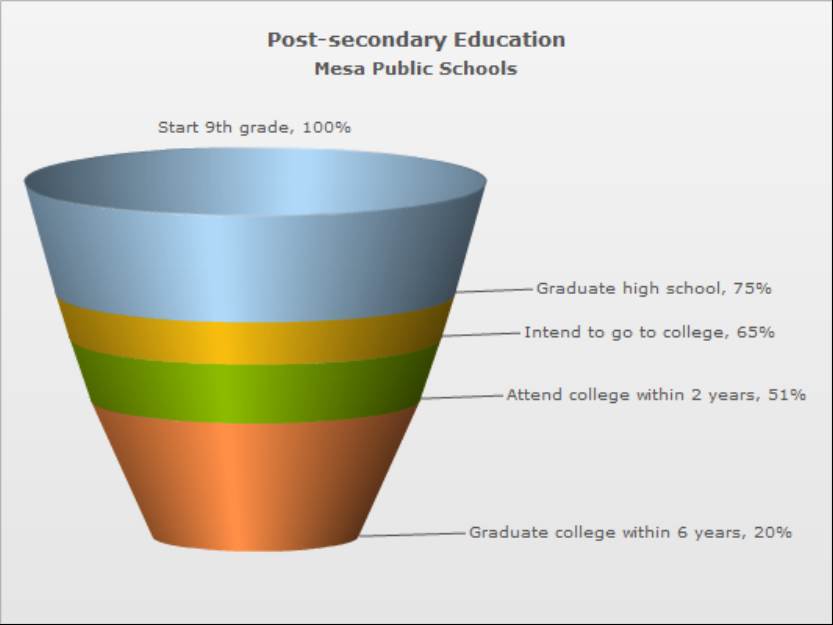
Mesa’s high school graduation rate of 75% is right in line with the national average, and their college-going rate is only a bit lower.
But of the students who start 9th grade in Mesa Public Schools, only 20% actually finish college a decade later. That’s a lot of dreams deferred or denied — and our goal is to figure out why.
We can get some hints by breaking down the data. More than a third of Mesa’s graduating class attends community college. Only 15% of Mesa students who go to these 2-year programs graduate, and another 15% transfer to four-year colleges.
Many of the students who attend community college are actually undermatching and could instead attend a four-year college if they wanted.
These are students who are in the top 25% of their high school class, and who do well enough on a math placement exam to get into college calculus. The community college graduation rate among these top students is much higher than the average graduation rate, but it’s still only around 50%, which is lower than the national average graduation rate for four-year colleges.
And that’s for the top students. For low-achieving students — who rank in the lowest 25% of the class and place into the lowest math class — the graduation rate from community college is a dismal 5%.
So Mesa has a lot of students who need to be better prepared for the challenges of community college. But among its community college attendees, there are also high achievers who might benefit from going to a four-year college instead.
Predicting undermatching students
So how do we find current Mesa students that are at highest risk of undermatching?
Even though we have a good intuitive understanding of what undermatching is, we need to start by coming up with a quantitative definition in terms of the data we actually have — a way to measure, roughly, the academic level of a college and the academic level of a student. Then, we need to analyze where thousands of former Mesa students ended up. We need to see how badly they undermatched their college, and learn what factors — the wealth of the student’s neighborhood, their GPA, and so on — were predictive of that undermatch. Once we know what undermatching students tend to “look like” academically and demographically, we can analyze data for current students and predict their risk of undermatching in the coming years.
We start by comparing students like Anthony and Ben to compute an undermatch score for every student. A higher undermatch score means a larger gap between a student’s academic performance and the academic level of the college they chose. Since Ben and Anthony have similar academic records but Ben went to a college with an average SAT score that’s 400 points higher, Ben would have an undermatch score around zero, and Anthony would have a score around 400 points.
Then we look at all of the data Mesa has collected on recent high school students — their transcripts, the classes they took, test scores, attendance, disciplinary incidents, and the demographics of their neighborhood — and find student attributes that have historically been associated with students who undermatch, who attend colleges with lower SAT scores than their academically similar peers.
For example, Mesa students that live in poor areas are much more likely to undermatch, as are students who live in areas with fewer college graduates. Some of the most important features are high school GPA, state test scores, and the number of absences.
Once we’ve learned which factors were predictive of kids who undermatched in the past, we’re ready to predict the futures of current students — kids who have yet to graduate that Mesa could target for intervention. This is the whole point of predictive analytics — being able to make good guesses about someone’s outcomes before they happen, when you can still change them.
We take those factors that were predictive in the past and use them to construct a model, so that we can take information about a graduating senior who has yet to apply to college, plug it into the model, and estimate how likely she is to undermatch.
Benchmarking predictions
But how do we know that our model is useful, that we’re actually targeting our interventions at the right students?
We can never be completely sure — it’s possible that next year’s students will be different from past students in ways we can’t predict and so different factors will contribute to undermatching. But if we assume that next year will be mostly like this year we can get an idea of how accurate our predictions are by taking academic data about 90% of Mesa students and building a model using only their data. Then, we can pretend that the other 10% — the ‘holdout set’ — are new students whose ‘undermatch scores’ we are trying to predict, and see how close our undermatch predictions compare to their actual outcomes.
When we test our model in this way, it does pretty well — when we look at our list of the 100 highest-risk students and compare it with the 100 students with the highest actual ‘undermatch scores’, 60 of the students in our predicted list are also in the ‘true’ list. That’s a lot better than random, and it means that Mesa administrators should be able to use our model to find the kids that need better information about their college choices.
We’re hoping that they will use our work to find students like Anthony and stop them from selling themselves short in the college matching process so that they can realize their full potential — and that the result will be more college graduates, more fulfilling careers, and a greater equality of opportunity.
To learn more about our project, visit our GitHub page.