In October 2012, when Hurricane Sandy raged up the East Coast of the United States, many people in the path of the storm turned to a relatively new communication channel: Twitter. Between October 27th and November 1st, as the storm hit New York City and surrounding states, more than 20 million Tweets about the storm were sent out on the social media service.
This superstorm of tweets reflected a growing trend: from #snowpocalypse to #Sandy, Twitter users have shared news, photos and observations from the midst of recent hurricanes, blizzards, earthquakes and other emergencies. As a result, first responders have started tracking social media streams to find valuable information about what’s happening in the sometimes chaotic midst of a natural or manmade disaster.
But there’s a problem with this approach: as with most social media conversations, informative signals are often drowned out by tons of irrelevant and redundant noise. For every useful tweet about a downed power line during a storm, there may be hundreds of tweets sharing jokes, idle observations about the weather or a viral photograph. First responders struggle to glean actionable knowledge from the flood of tweets and status updates.
We need better methods to find the needles in this haystack of unstructured text. What if we could develop a tool that automatically sifts Twitter for relevant, first-hand reports about human casualties, infrastructure damage and other important events during natural disasters?
The Qatar Computation Research Institute (QCRI) is an organization that uses computation and multidisciplinary research for the benefit of society. Through QCRI, Data Science for Social Good fellows built a Twitter-mining tool for the Red Cross, the United Nations, and other relief organizations who depend on swift and accurate information to help people during disasters.
A pipeline for disaster tweets
Early on in the fellowship, we met with representatives from the U.N. who said they wanted a tool that would not only detect when human casualties or infrastructure damage occurred, but also what kind of disaster event caused them. That’s because different crisis scenarios demand different responses — a collapsed building might require a search and rescue squad, while a flooded hospital might need immediate medical aid and electrical engineers.
So DSSG fellows Christopher Brown, Manojit Nandi and I, along with our mentor Aron Culotta, set out to build a system that could quickly extract where disaster events are taking place, what category of event they are, and any documented human victims or physical damage.
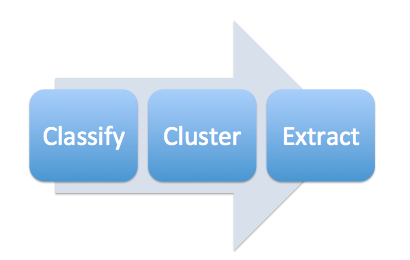
The data mining pipeline we built has four parts: classification, extraction, clustering/merging, and mapping.
Classification
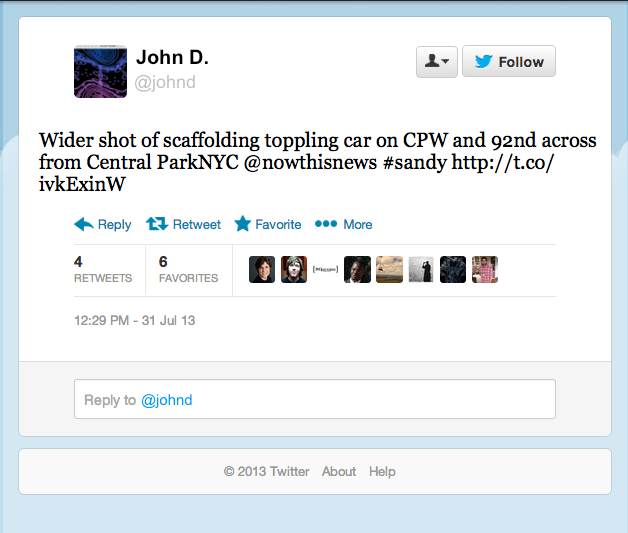
People tweet about all kinds of things. We want to flag only those tweets that are related to natural disaster events – messages which, like the one below, contain information about human casualties or infrastructure damage.
In essence, we’re trying to detect disaster events – such as a highway flooding, or a building burning down – through crowdsourced reports about the damage from these events.
In machine learning and statistics, this is called classification: given a fresh tweet, we want to be able to reliably give it a “Disaster Event” or “Not Disaster Event” label.
First, we need to manually label several hundred tweets this way. Without labeled data, our classification algorithm can’t learn what “disaster” and “non-disaster” tweets look like.
Next, we use a Supervised Latent Dirichlet Allocation (SLDA) algorithm to find groups of words, or topics, that tend to be associated with disaster and non-disaster tweets. Here’s one such topic:
“help donate blood safe victims affected”
The idea behind topics is that humans tend to articulate ideas – “help sandy disaster victims” – using distinct sets of words – “donate”, “blood,” and so on. There may be hundreds of different tweets expressing this same idea, each using slightly different wording, but in general they tend to share a small set of keywords. These keywords, then, define a single topic. There may be dozens of these topics swirling around Twitter during a disaster.
To discover these topics, the SLDA algorithm chews through all the words in all the tweets we’ve labeled, and groups together words that occur together in tweets more frequently than we would expect by random chance and also tend to be present in tweets labeled “Disaster Event.”
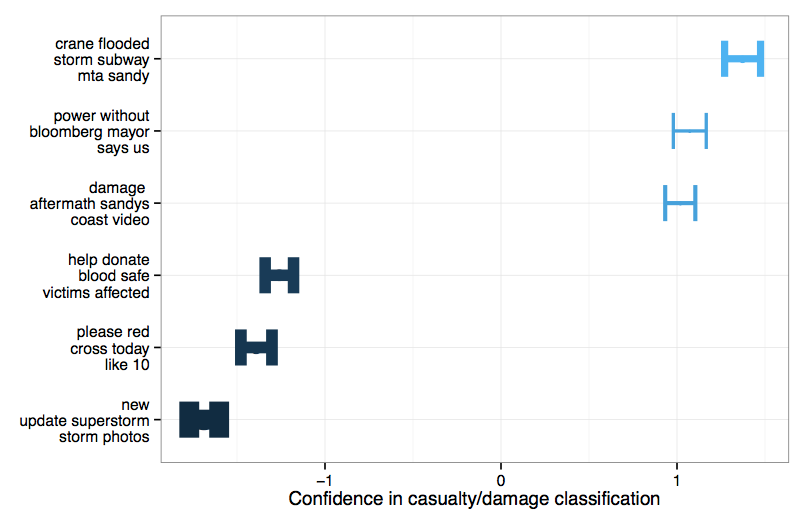
For example, we found that #sandy tweets containing the topics…
- “crane flooded storm subway mta sandy, ”
- “power without bloomberg mayor says us”
- “damage aftermath sandys coast video”
…were more likely to be labeled “disaster event” – because they discussed human casualties or infrastructure damage – than tweets with the topics
- “help donate blood safe victims affected”
- “please red cross today like 10”
- “new update superstorm photos”
The chart below captures how confident our algorithm is that tweets that contain each of these topics should be classified as “Disaster Event”:
Once our classification algorithm has “learned” what topics are out there – and whether they tend to show up in disaster event tweets – from reams of labeled data, it can classify new, unlabeled tweets as “Disaster Event” or “Not Disaster Event” based on the topics it detects in them.
In other words, this “trained” algorithm could potentially be deployed during future disasters to quickly filter for tweets that are talking about disaster-related events. If our classification algorithm works well, it allows us to find the needles in the haystack of Twitter.
Clustering and Merging
The problem is there are too many needles. Every disaster brings lots of redundant tweets discussing the same thing, and we don’t want to show these over and over to first responders. So we also need some way of detecting similar tweets and getting rid of them. We do this with clustering.
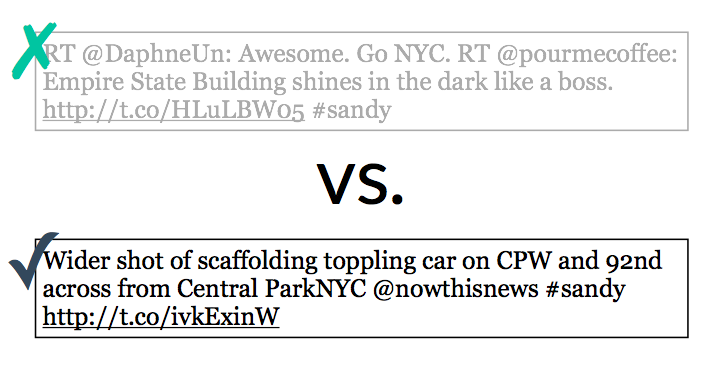
All three of the tweets above are discussing the same event. It’s easy for humans to make this judgement, but what happens when there are thousands of Disaster Event tweets to sort through? The trick is to teach computers how to measure the similarity between messages.
We do this using a bloom filter. At a high level, bloom filters work by converting written messages into a unique set of numbers. The number signatures of multiple tweets can then be compared with each other — identical messages should have the exact same numbers — and you group together the messages with “similar” numerical signatures.
Notice that the top tweet in our example is the most useful to disaster relief workers, because it contains actionable information about the location of the disaster and who/what was potentially affected by it. Ideally, the goal is to make our tool not only group together similar messages, but automatically select the most information-rich tweets while tossing out less informative ones.
Extraction
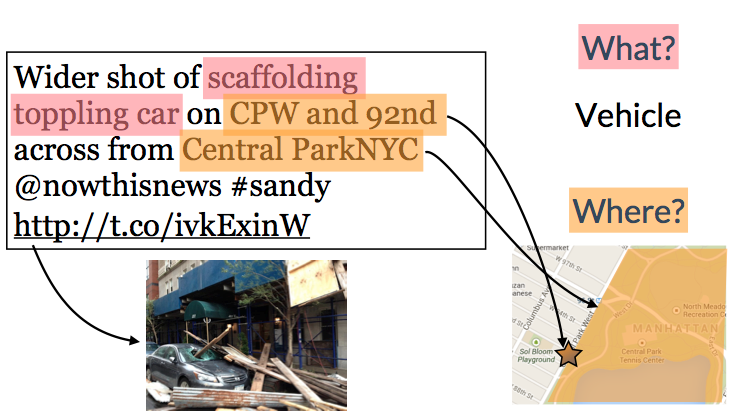
In the information extraction phase, we extract actionable bits of information from our relevant tweets. Let’s dig deeper into the disaster-related tweet we displayed earlier:
The tweet describes an event that requires the attention of a first responder and also gives a specific location. In this phase in the pipeline, we automatically extract specific event information from the tweet — “scaffolding toppling car” — as well as event location details — “CPW and 92nd” and “across from Central ParkNYC”.
We’re using a conditional random field (CRF) to extract these event types and locations from the tweets. A conditional random field is a statistical model that is often used for recognizing patterns in human language. CRFs are especially useful for labeling sequential data, such as written sentences, genes or spoken word. For example, a CRF could help you label the parts of speech of each word in a sentence, or the genes in a long, unbroken DNA sequence.
Our goal was to teach our CRF to automatically label words in sentences that capture the “what” and the “where” of a disaster event. Once again, we started by labeling specific phrases in hundreds of tweets. Our CRF looks at a list of properties of each word — whether it was capitalized, pluralized, parts of a pre-determined list of keywords, whether adjacent words were labeled, and so on — and try to find word properties that were associated with “what” and “where” labels.
Once trained, our algorithm can look at new, unlabeled tweets, and attempt to extract phrases in them that describe where the disaster event took place — and what kind of event it was — so we can map them.
Mapping and Visualizing
Ultimately, we provided QCRI with an application programming interface (API), a piece of software infrastructure that takes in a stream of tweets during a disaster, finds relevant messages, filters out redundant ones, and extracts events and locations the remaining tweets. This API could be the data backbone of any number of disaster response apps, including tools that map disaster event locations in near real-time and highlight unfolding events with human casualties and infrastructure damage.
QCRI is currently building a user-facing app that would utilize our API in this manner. When complete, the system should help relief workers from the Red Cross and other disaster relief organizations rapidly discover where human casualties and infrastructure damage are taking place, leveraging all tweets about the event — not just those seeking help.
To learn more about our project, visit our GitHub page.
